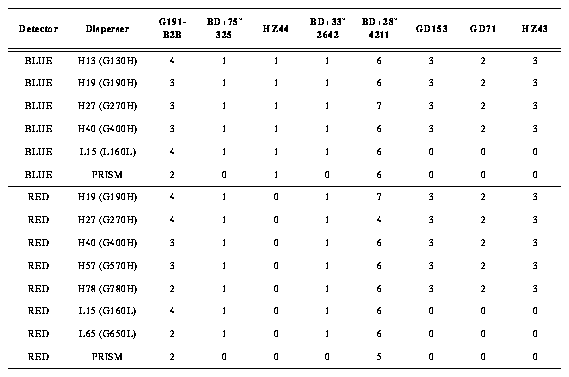
Number of Visits to Standard Stars for Each FOS Dispersion Mode

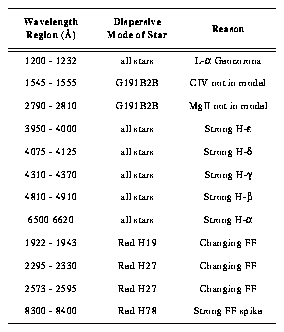
A least squares cubic spline is fit to the logarithm of the raw sensitivity curves to generate a smooth sensitivity curve. Table 2 lists the regions on the red digicon with photocathode blemishes that have not yet been adequately removed by flat fielding and the regions on both detectors with strong spectral lines. These excluded regions are masked in the fitting process; and the spline fits across these gaps can be potential sources of spurious wiggles at the 1-2% level in the sensitivity fits. Therefore, new sensitivity curves should be generated whenever there are upgrades to the flat field corrections.
Regions Excluded From the Sensitivity Computation

The number of spline nodes used in each disperser mode is given in Table 3. An asterisk indicates that unequally spaced nodes are used. In these cases, nodes are placed at specific wavelengths to follow better the curvature of the sensitivity function.
FOS Modes and Number of Spline Nodes

The average sensitivity curves are shown in Figure 1. In the case of L15 blue, the wavelength range in Table 3 is more than a factor of two, so that there is contamination of the first order longward of ~2300Å by second order light. Quantitative estimates of this problem are provided by FOS sky spectra, which have a count rate due to second order Lyman-alpha of about one-half of the first order count rate. For a continuum source, the doubling of the dispersion in second order causes a drop in the relative contamination by another factor of two. The relative sensitivity to a continuum source at 1216Å vs. 2432Å is a factor of 48, so that for a flat continuum source (F(l)=constant), the first order light contamination at 2432A is only ~0.5% and has been ignored in the L15 calibration results. For our hottest stars, the continuum is not flat but rises by a factor of 6 from 2400 to 1200Å, so there would be ~3% contamination by second order light at 2432Å.
Generated with CERN WebMaker